
LET'S SPOT SPIDERS!
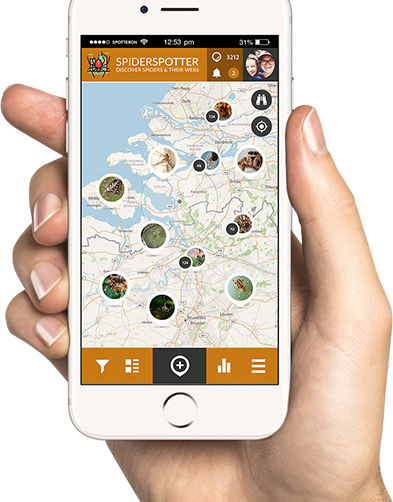
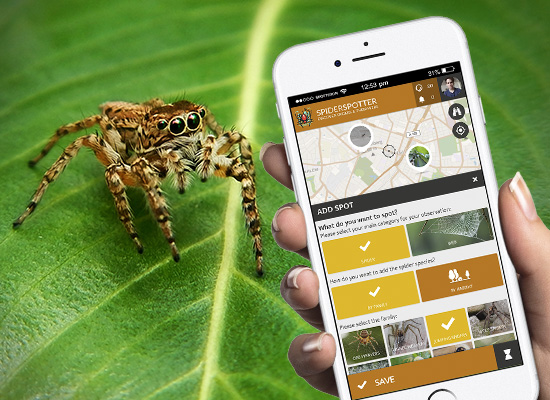
Download the SpiderSpotter App for Android or IOS and help with your observations!


Download the SpiderSpotter App for Android or IOS and help with your observations!
Do spiders in cities build their webs differently from spiders in natural habitats? Use the SpiderSpotter Card to help research!
Download it here

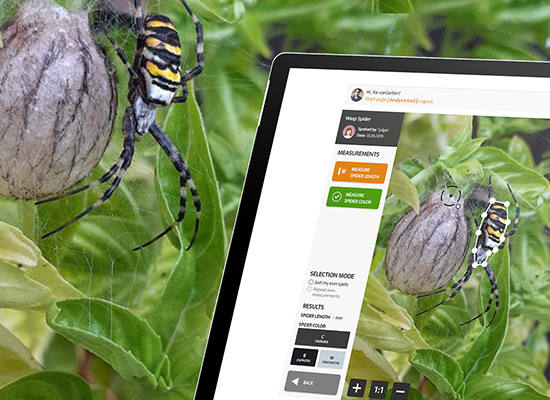
Welcome to the user manual of the Spider Spotter Analysis tool! In this tool you can analyse your spider pictures and calculate the colour of your spider and measure its length!
On the starting screen you can see your picture in the centre and a column to the left and right. Underneath the page, you can see that “BACK” and “SKIP” buttons that allow you to navigate through the pictures.
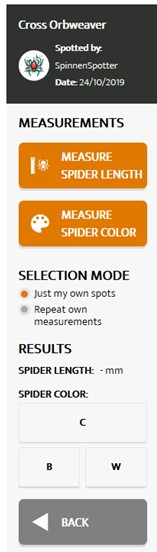 In the left column you can find:
Picture details.
Two measurement buttons for spider colour and length.
Selection mode where you can select to analyse all spider pictures or “just my own spots”. You can also select to “repeat your own measurements”.
Results section. Here, the results of your measurements will appear!
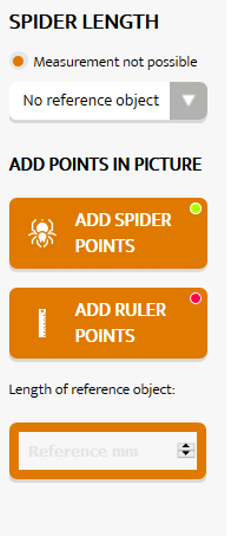 Spider Length:
Clicking the “measure spider length” button reveals the right column where you can indicate if the measurement is not possible due to a missing reference object, the picture being too blurry or too dark, the spider being too small or if there is no spider in the picture.
You can only measure spider length if there is a reference object in the picture that can be used as a standard. This can be a ruler or any other object of which the dimensions are known.
There are three steps to measure the length of a spider:
The length of your spider is now automatically calculated and appears in the results box!
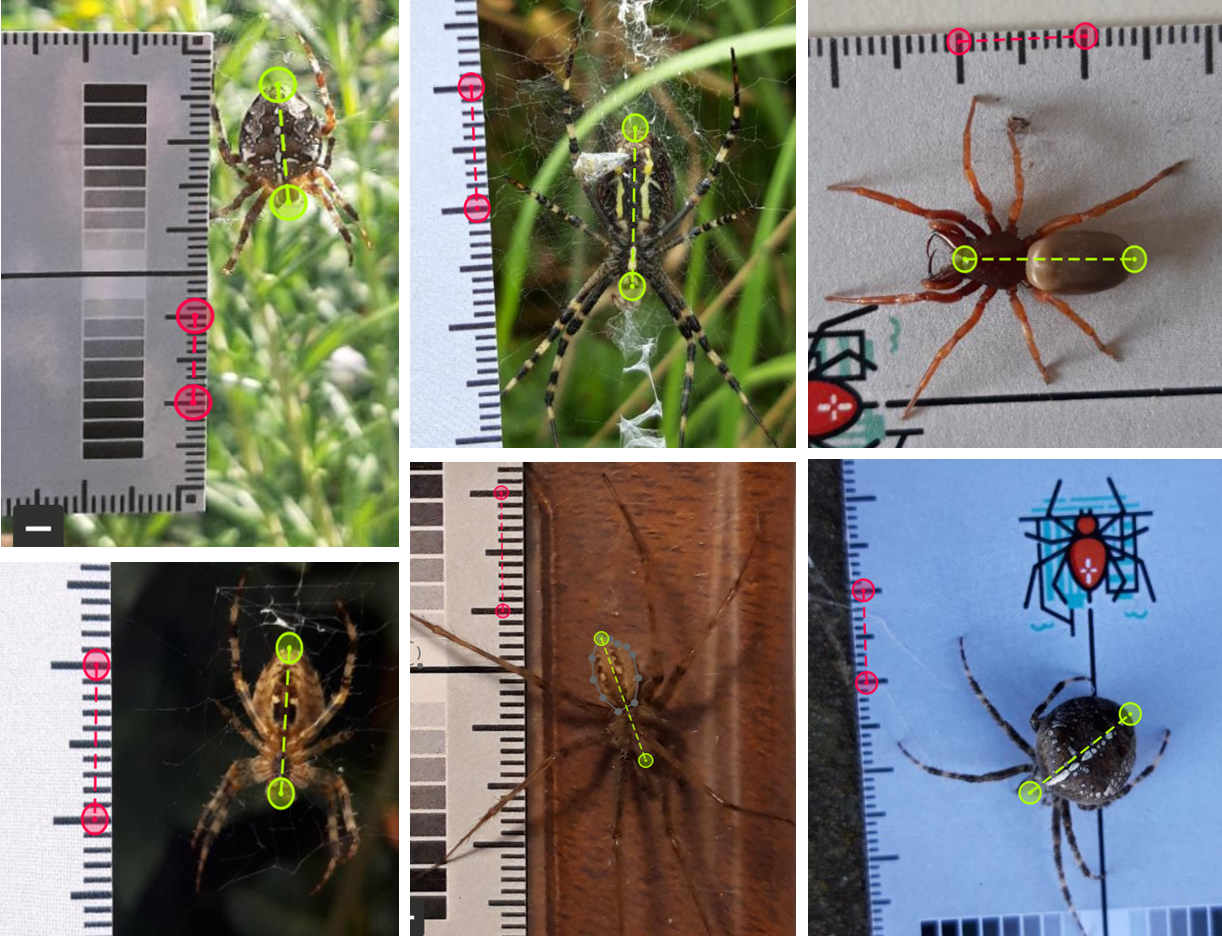
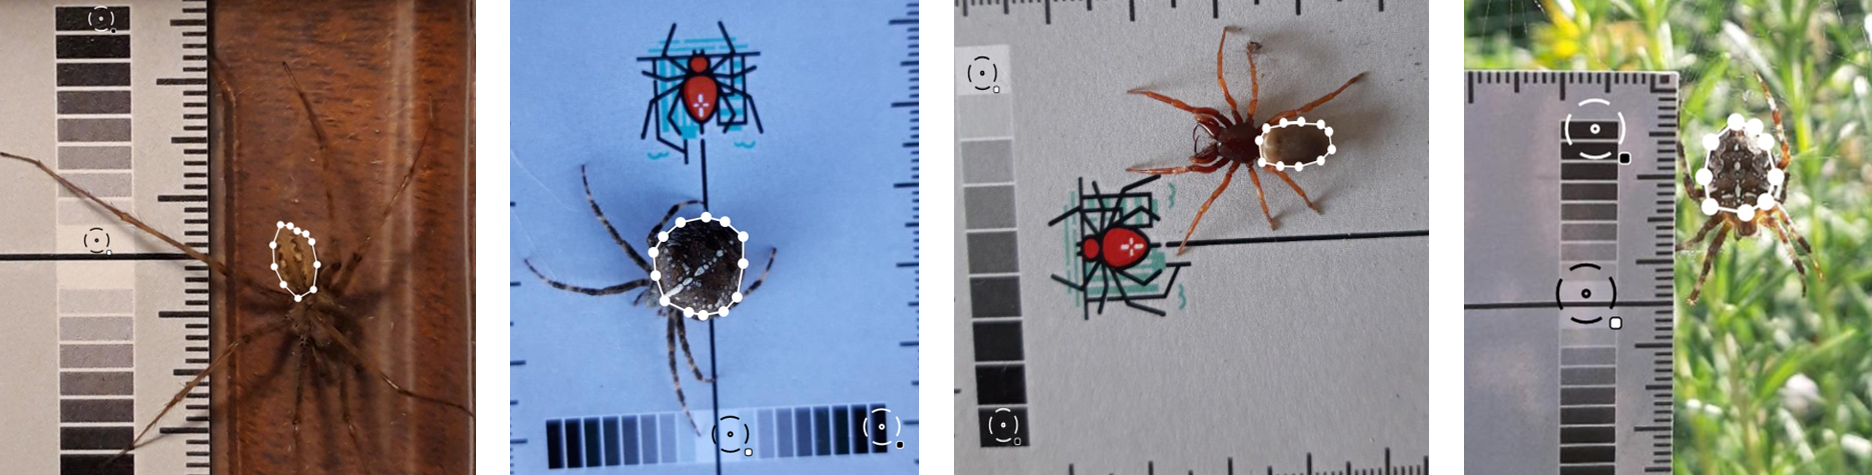
Have a look at these examples how to put the points on the spider and ruler!
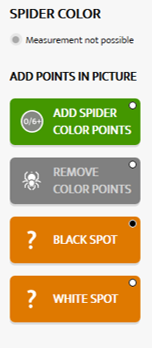 Spider Colour:
Clicking the “Measure Spider Colour” button also reveals the colour analysis menu on the right side where you can indicate whether the measurement is not possible due to the picture being too blurry or too dark, the spider being too small or if there is no spider in the picture. In contrast with measuring spider length, you can also calculate spider colour if the calibration card is absent!
There are three steps to calculate spider colour:
The colour of the abdomen of your spider is now automatically calculated and appears in the results section. The box with the large C is filled with the colour of your spider (averaged for the entire abdomen) and the RGB values are given in between brackets. This Red/Green/Blue value determines every colour by indicating the intensity of Red, Green and Blue. Black has a value of 0/0/0 and white of 255/255/255. You can play around with RGB values on this website : https://www.rapidtables.com/web/color/RGB_Color.html
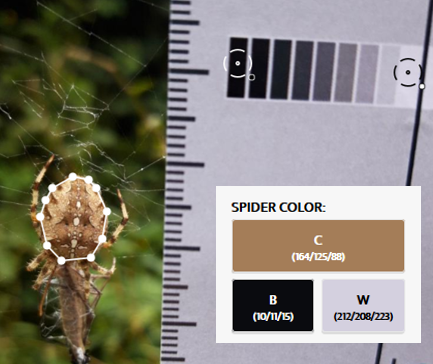
You will see that the spider colour can be influenced by how bright a picture is (light intensity). If you take a picture of the same spider in the sun or in cloudy conditions, the colour is be different depending on light intensity. That is why you select the Black and White square on the Calibration Card as it allows us to afterwards correct for the light intensity in your picture!
Here are some more pictures that illustrate how to put the spider colour points on the abdomen:
If you are happy with your measurements, you can click the “Send” button. This will register your spider picture results in our database!
|
Project by:
|
Citizen Science toolkit by:
|
|
Ghent University |
SPOTTERON Gmbh |
Have you ever walked around the city in the summer? Then you know it can get very hot because of all the asphalt and the concrete that retains the heat! Staying cool in this heat is not only a problem for humans, but also for animals. But this is just one of the challenges they face. The city is a completely new environment that they must be able to adapt to. Cities can therefore be seen as "living laboratories" where evolution takes place in real time! In the SPIDER-CITY project we want to investigate how spiders can adapt to city life.
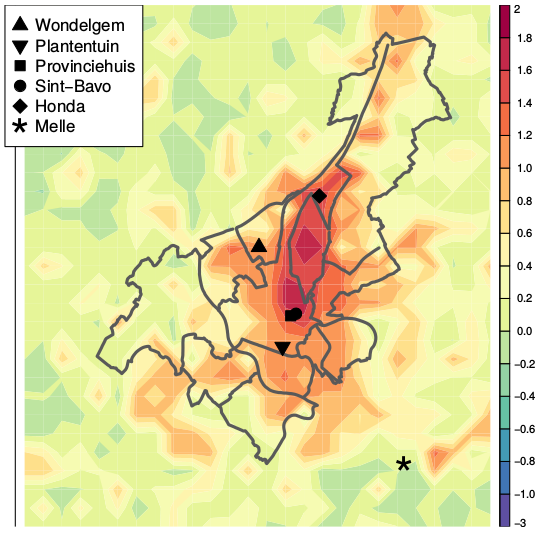
In the centre of Ghent it gets hotter than in the countryside (Steven Caluwaerts, http://www.observatory.ugent.be/)
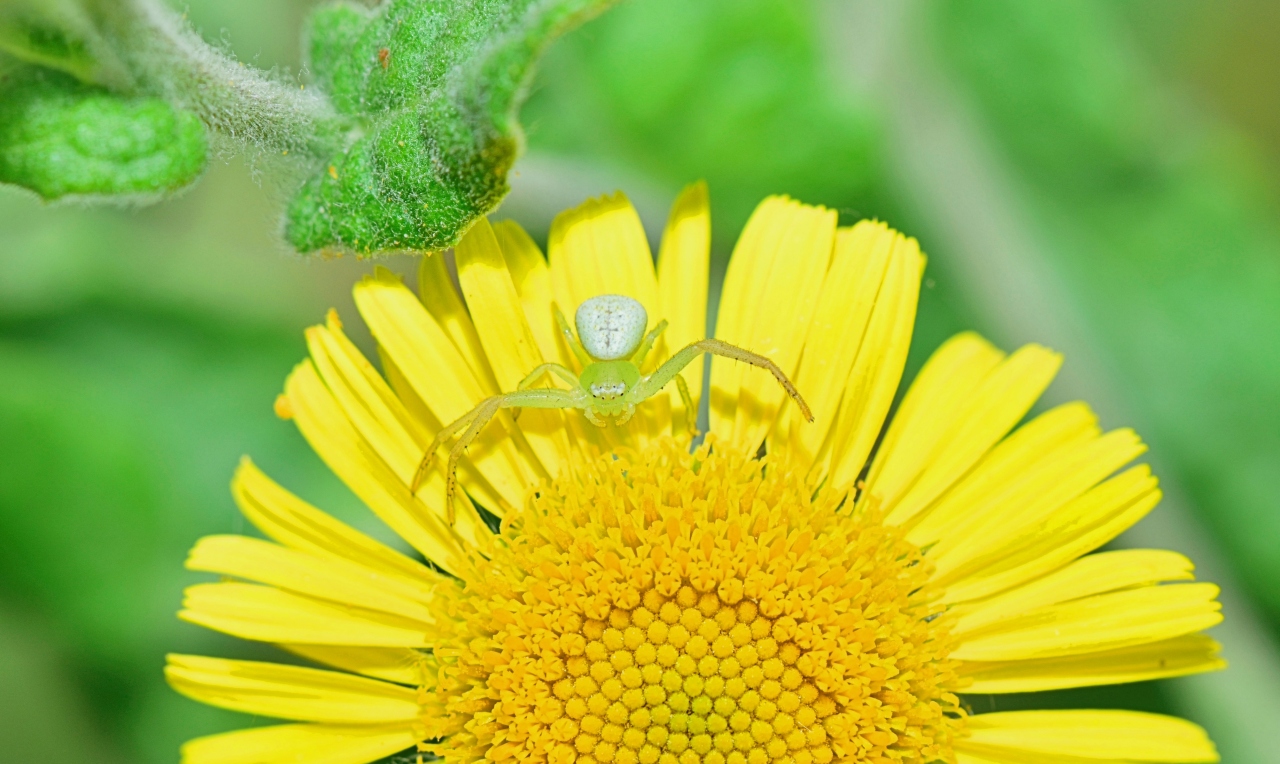
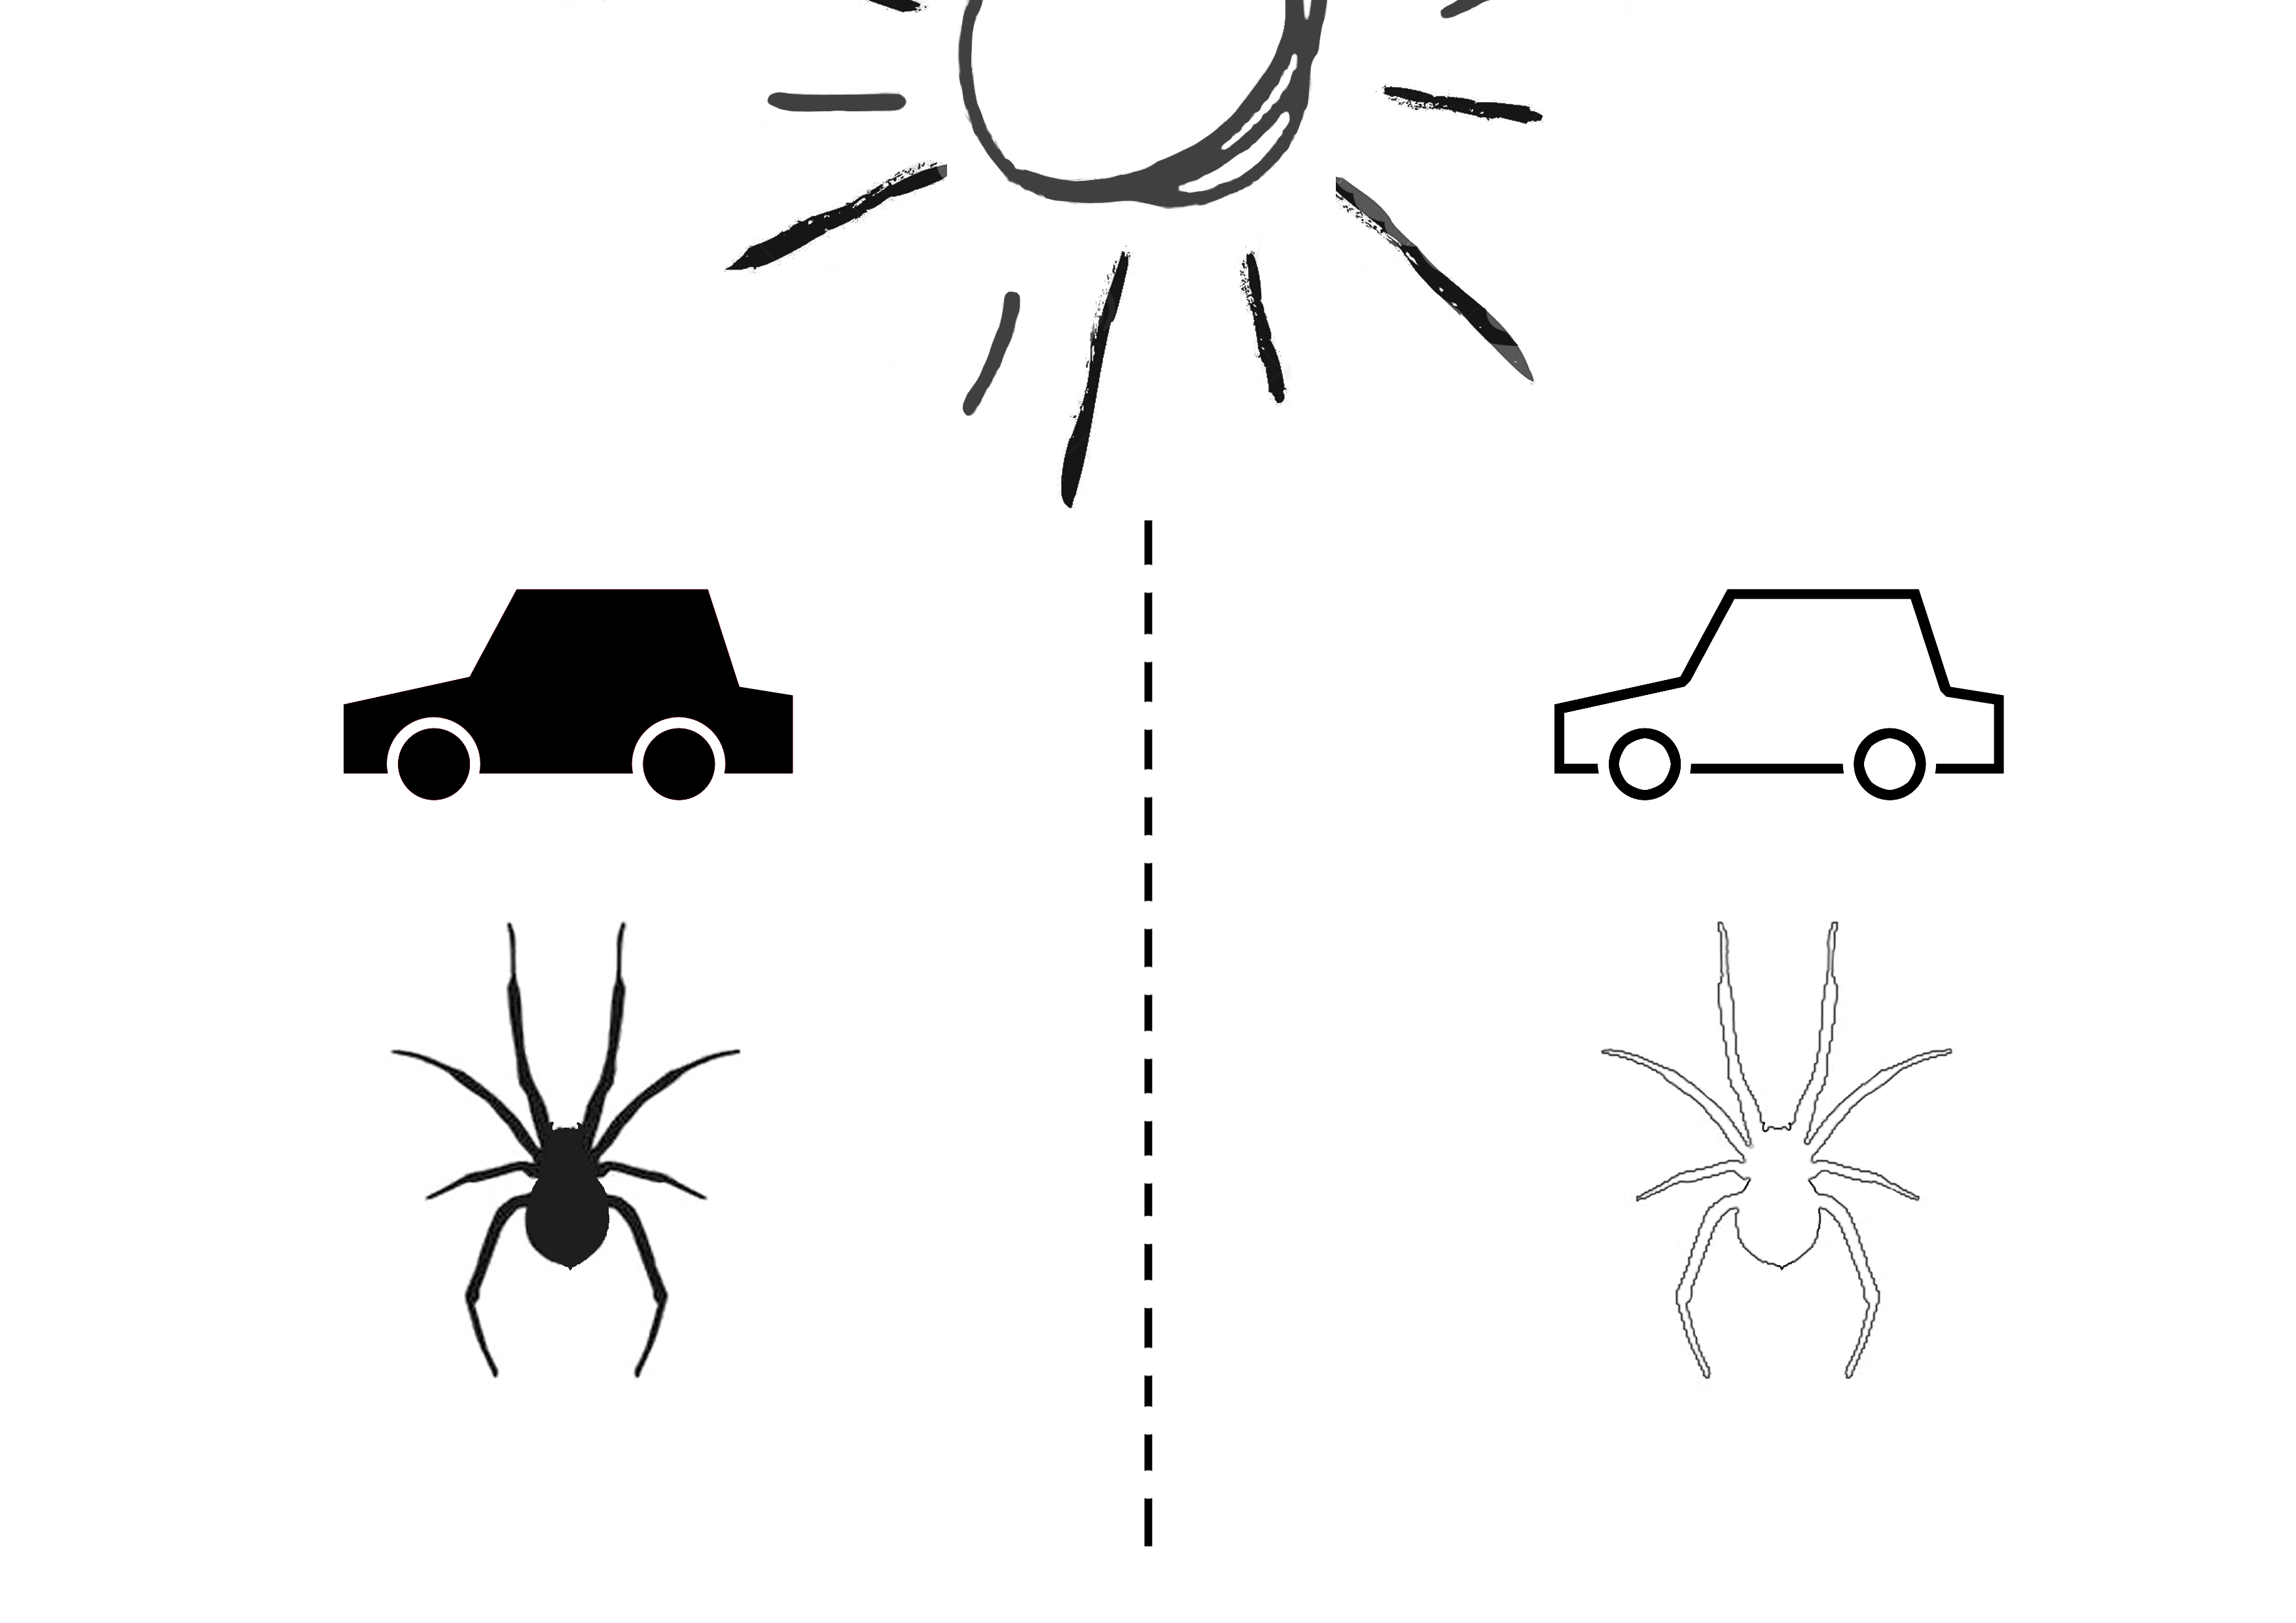
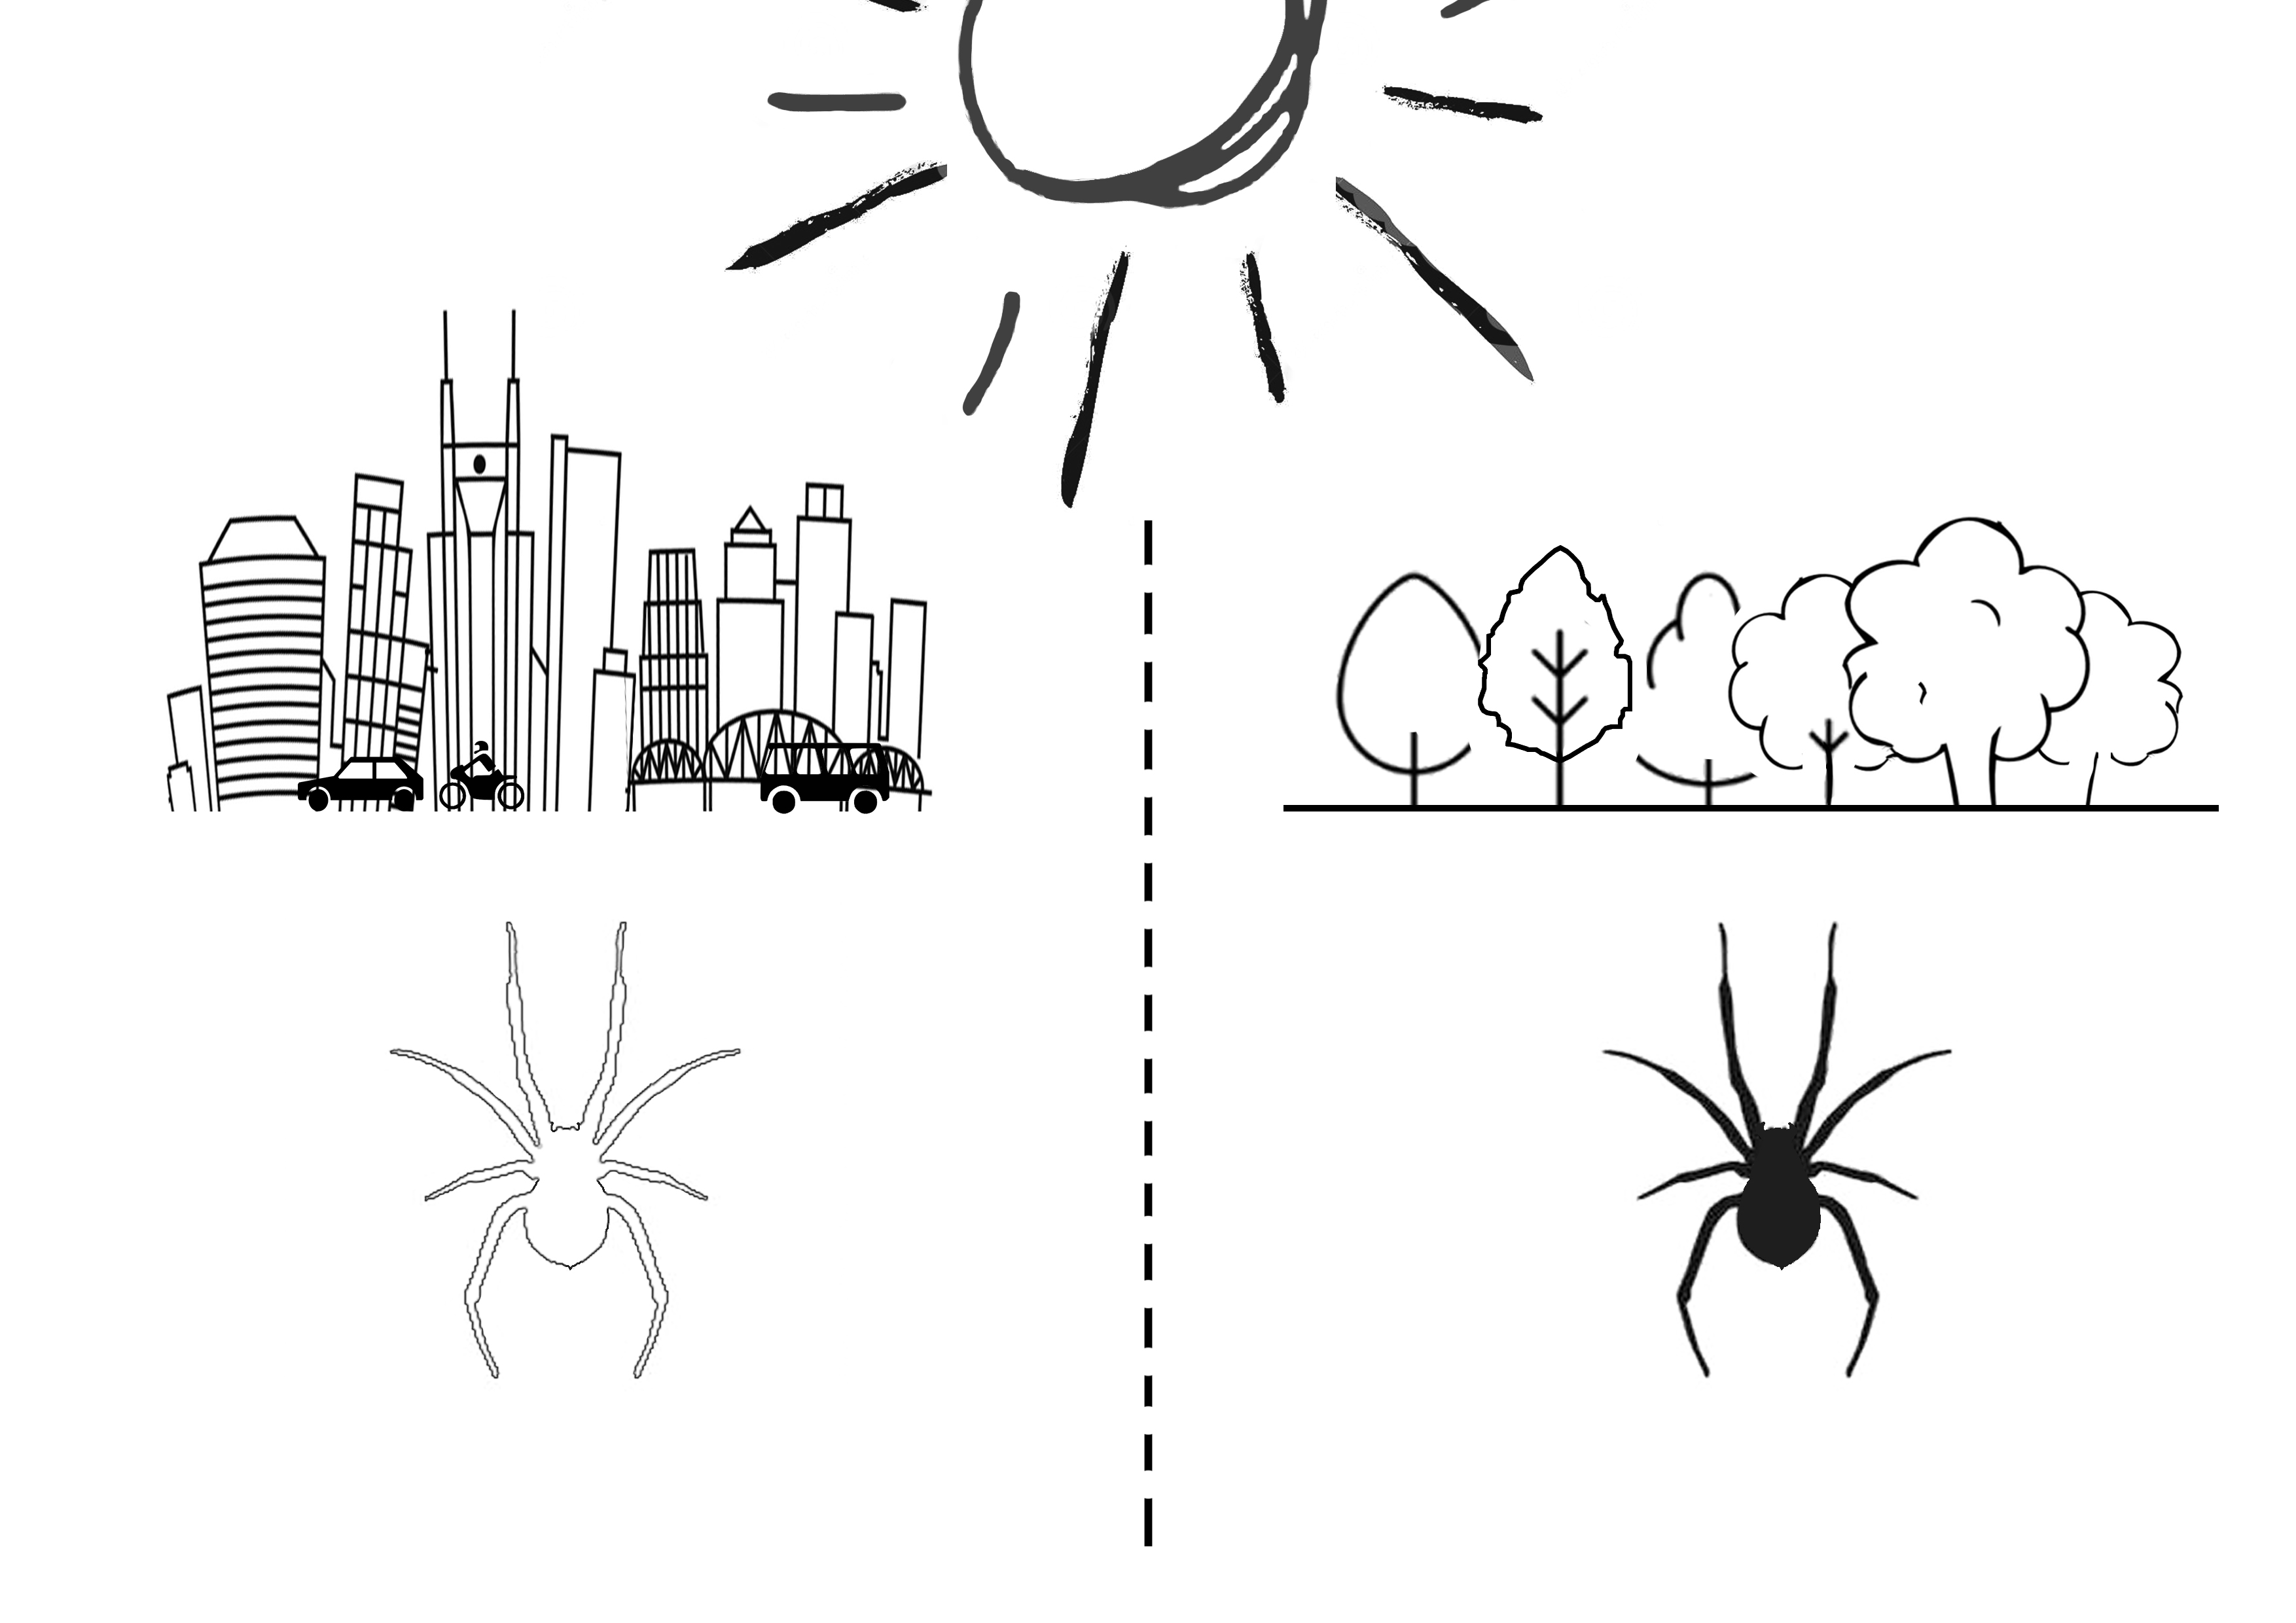
Spider colour: Much like a white car heats up less in the sun compared to a black car, so does a lighter spider heat up less compared to a dark spider. Therefore we expect city spiders to evolve a more lighter colour as this protects them from overheating in an already hot city.
Spider webs: As the main tool for prey capture, webs are crucial for spider survival. Due to a lower supply of prey in cities, we expect to see webs with a smaller mesh size that are more efficient in capturing prey.
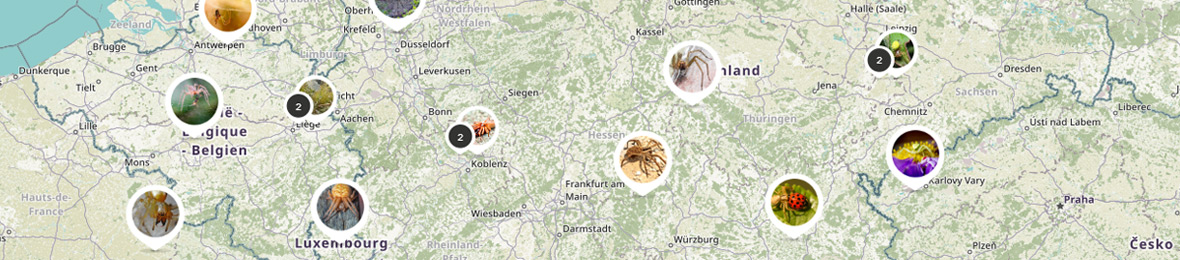
You can participate in the SPIN-CITY project in several ways. With the SpiderSpotter app you can take pictures of spiders and their webs or you can pass on specific observations. You can then analyze your own photos and those of others on the SpiderSpotter website, calculating the color and length of the spider or web. We are currently developing this tool and it will be available at the beginning of 2020. Photos that you are taking now will then be available for analysis. An interactive map ensures that our results are accessible to everyone who is interested!
This workflow allows to set up your own scientific project, from data collection to analyzing data to viewing results. It is perfectly possible to only take pictures or to only analyse them. You are not obliged to go through the entire process, you can join in wherever you want. This approach can be specifically interesting for schools and other organizations that want to have a taste of the scientific method. We are therefore currently also working on putting together an supporting package on how Spider-City can be used in the classroom.
Not only do we get crucial information about how animals can adapt to climate change, studying spiders can also be very useful for us humans! We can use spider color as a natural thermometer and thus better determine how quickly our environment heats up. And who knows, by examining in detail how a spider uses color to stay cool, we might even find new ways of staying cool in the city ourselves!
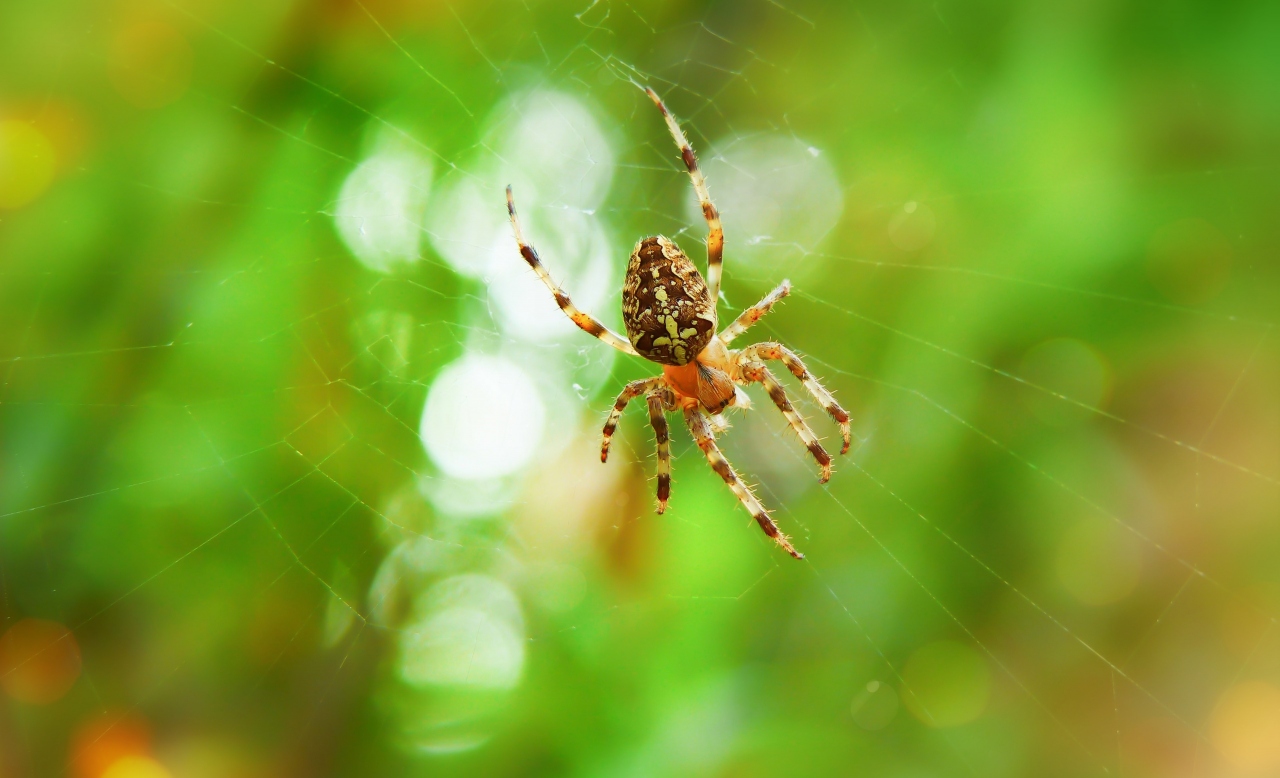
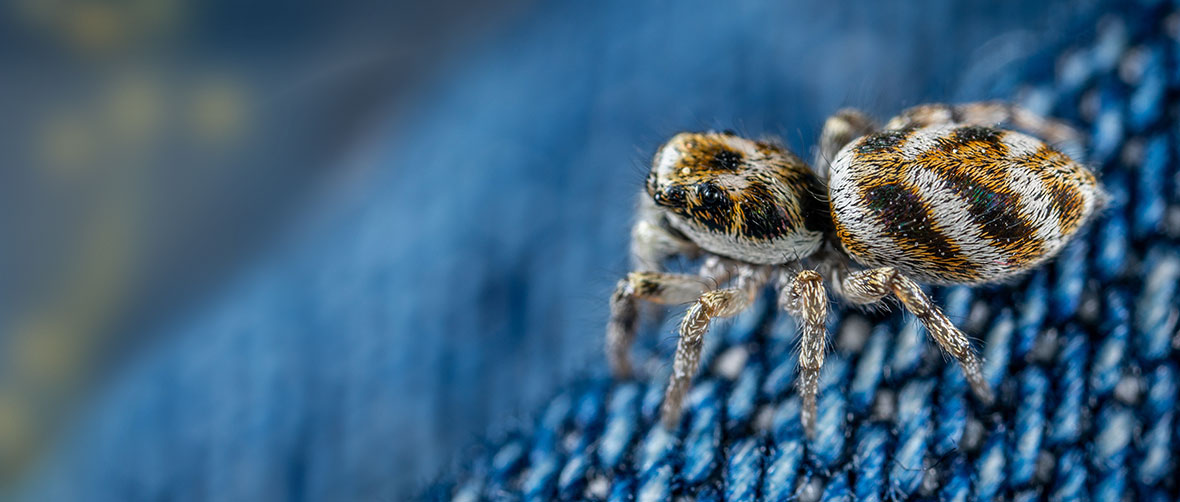
We are interested in photos of all species of spiders! One of the most important ones is the Cross Spider (Araneus diadematus), a common species that is easily recognized by the white cross on the back. The spider is often found in the middle of its orbweb, making it easy to photograph! The Cross spider comes in many different colors, ranging from light brown to orange-red to dark brown and black. Scientists currently don't know why, could it have something to do with the warm city?
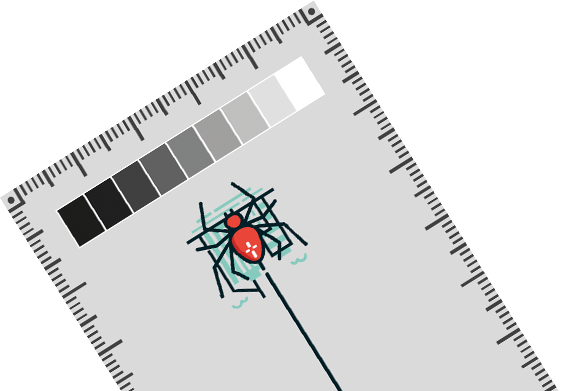
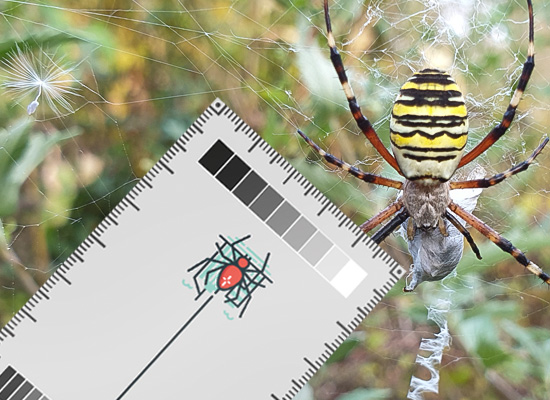
To accurately calculate spider size and colour from a picture, a reference needs to be added with known length and one that takes into account differences in light intensity (a picture of a spider in the sun will be more light than a picture of the same spider in overcast conditions). For this reason we designed the SpiderSpotter Card that has a length measurement and a grey scale. Ideally, this strip should be included in the picture. The SpiderSpotter Card can be downloaded below and printed yourself. Put the printer settings on best quality as this will improve the printed grey scale. You can also order it at This email address is being protected from spambots. You need JavaScript enabled to view it., provide your address and the number of cards you need and we will send them to you!
Don’t worry if you don’t have a card, you can add an everyday object with known length such as a coin/ruler to measure size or take pictures without anything added. These are still highly valuable for the project as they still give a lot of info on size and colour!
Tips for spider pictures:
* Point the camera perpendicular to the spider, preferably with view of the back (dorsal).
* Hold strip as close as possible to the web and next to the spider. This reduces measuring error. Make sure the entire grey scale is visible. Watch out to not disturb the spider as it will flee!
* Focus on both strip and spider.
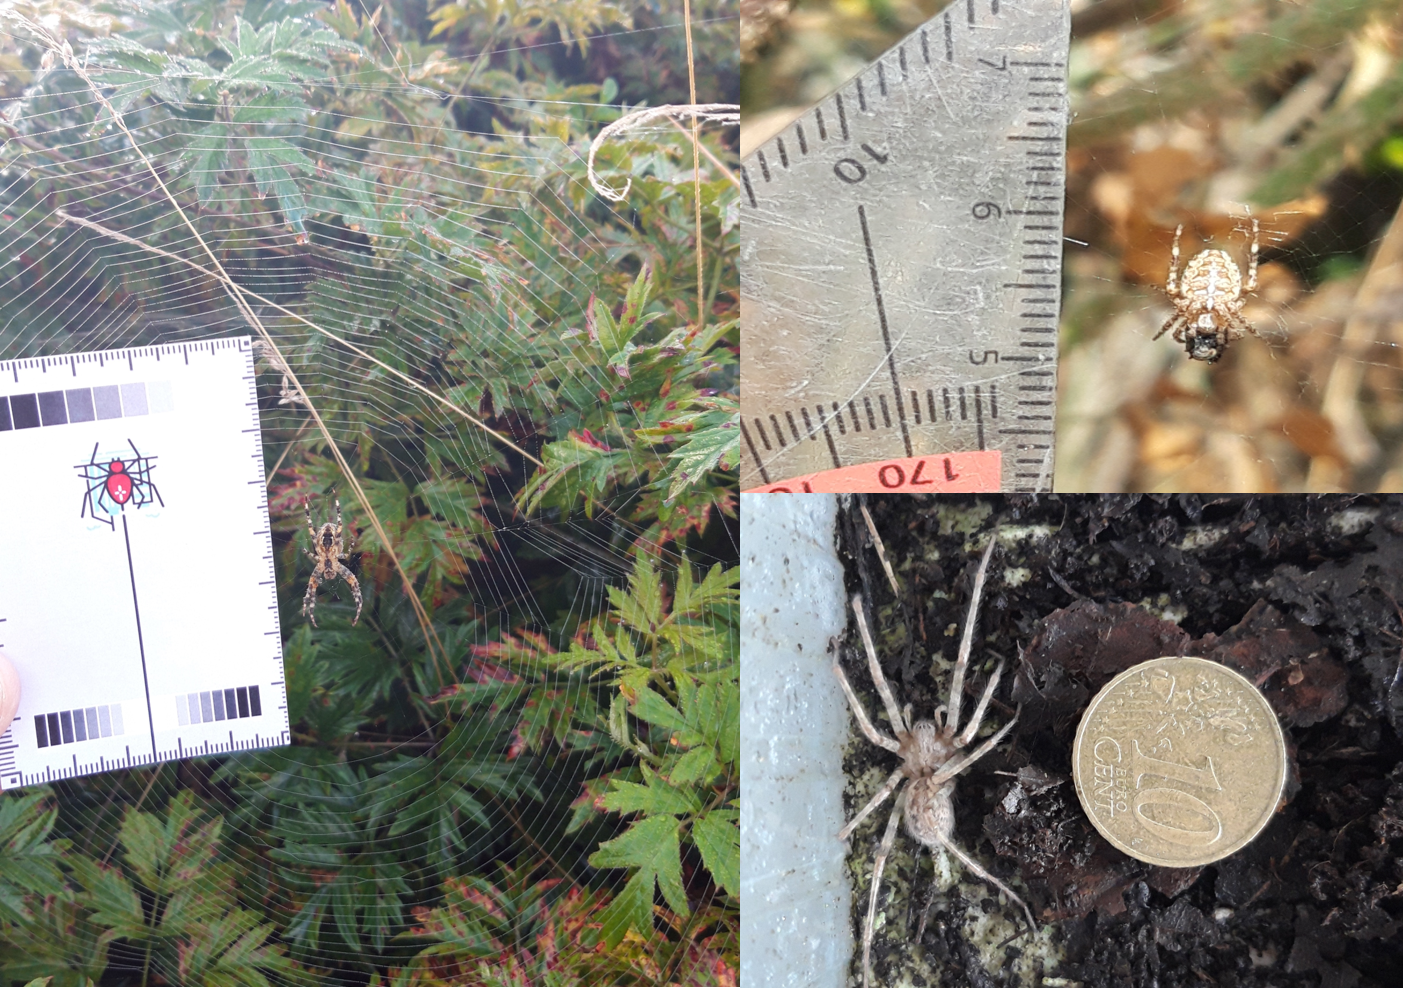
Example of spider pictures with grey scale and length measurement or an everyday object included. All pictures show dorsal side of the spider.
For webs you can take similar pictures, including the strip. However, webs can be challenging to photograph as they consist of very fine material that is hard to focus on (spraying the web with water using a plant sprayer can help!). That is why you can also directly input your measurements in the app!
To correctly investigate:
Orbwebs (see figure):
- Measure the length of the catching web from right outside the centre to top (arrow in grey area in the figure). Don’t include the hub, that is where the spider is often located.
- Count the number of crossing threads.
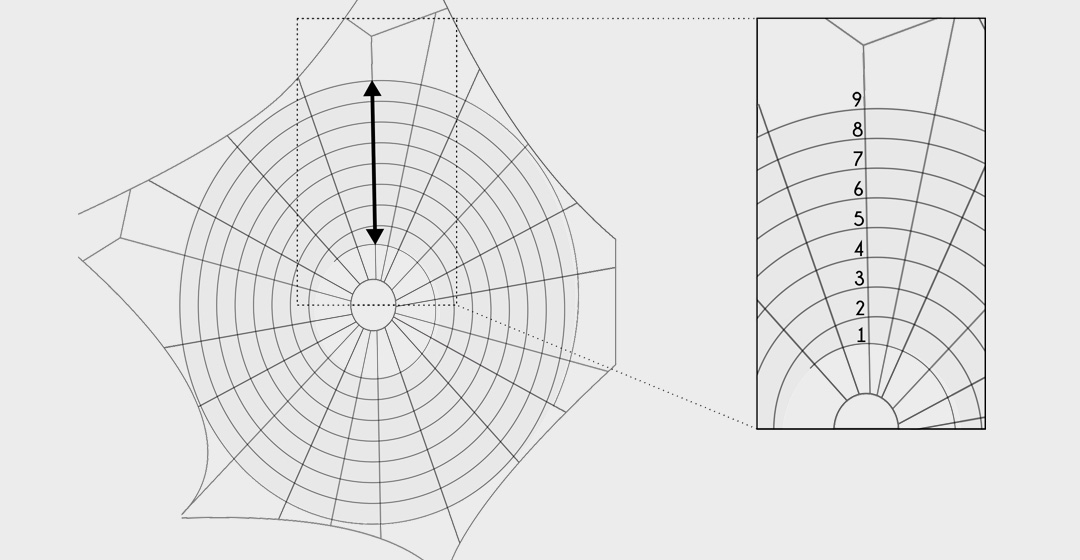
How to investigate an orbweb? First, measure the length of the catching web from right outside the centre to the top. Second, count the number of crossing threads. (Web figure modified from Dahirel et al. 2018, “Urbanization-driven changes in web building and body size in an orb web spider”, Journal of Animal Ecology, 88:1, 79 – 91.)
These two measurements allow to calculate the average mesh size!
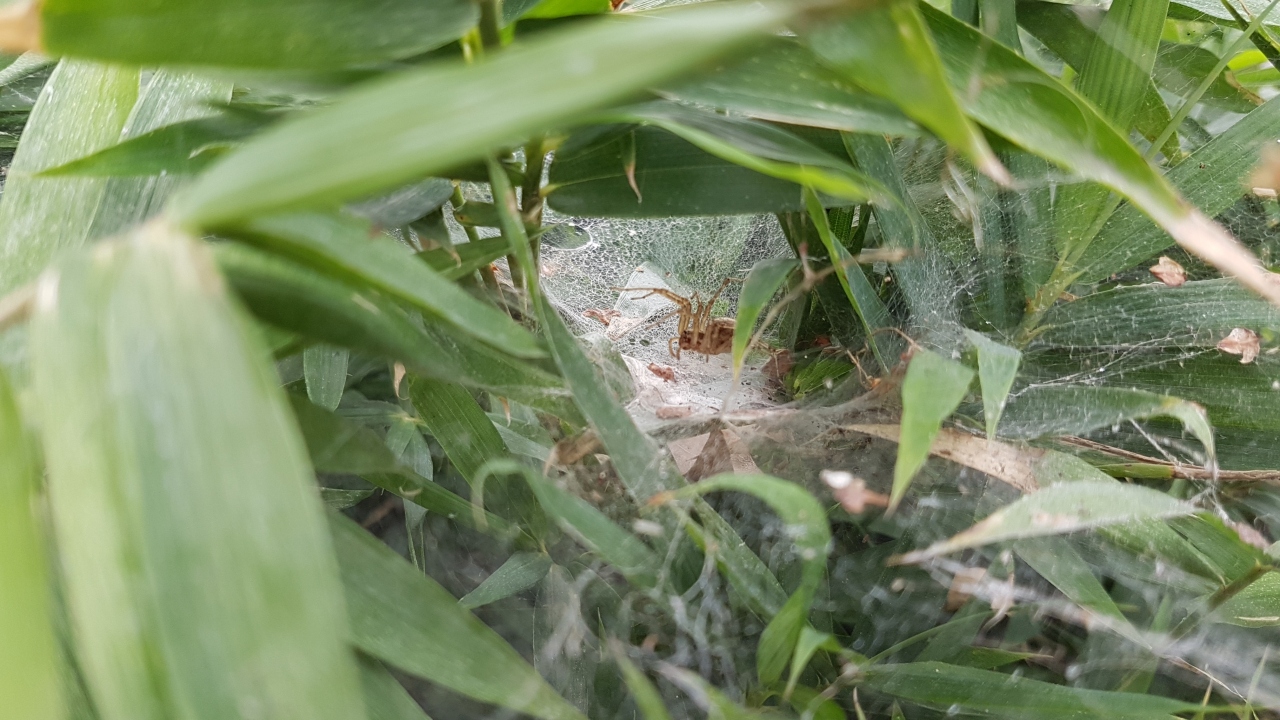
Other web types:
- Measure the maximum width of the entire web.
We learn most if we have size/colour and web info from the same spider. Using the SPOT UPDATES you can first take a spider picture and then use the + -pictogram to add web measurements!
Contribute your spider and web observations in the SpiderSpotter Citizen Science project and help scientists to study spider evolution in the SPIN-CITY project! Take spider pictures and investigate spider colour and webs to discover if spiders adapt to living in the city!
Download the App on your smartphone now or open the map in your browser:
Do you want to help measuring spiders for science? Download the SpiderSpotter Card for self printing at home and hold it in the pictures you take in the SpiderSpotter App. With the measurement reference, we can determine the size of your spider or web observation better. You can also order it at spiderspotter@UGent.be, provide your address and the number of cards you need and we will send them to you!
When holding the SpiderSpotter Card near the spider or a spider's web, please make sure that a ruler and one of the brigthness gradient strips is visible in the picture. You can read more about how to take the pics in our info section!
With the new SpiderSpotter Data Analysis Tool, you can actively participate in generating scientific data! The online interface fetches spider observations live from the Citizen Science App and offers a range of tools to measure the size and the average colour of the spiders. Simply access the Data Analysis Tool and log in with your App account!
You can even select an option to just work with your observations from the App and export your measured data if you want to do your own analysis.